
Is the system performing in the way the property actually uses energy?
Place production beside consumption to see the gap between a system's output and the home's rhythm.
S+UThe SolarFax® platform brings solar production and utility consumption into one view, so system performance makes sense in the context of real energy use.
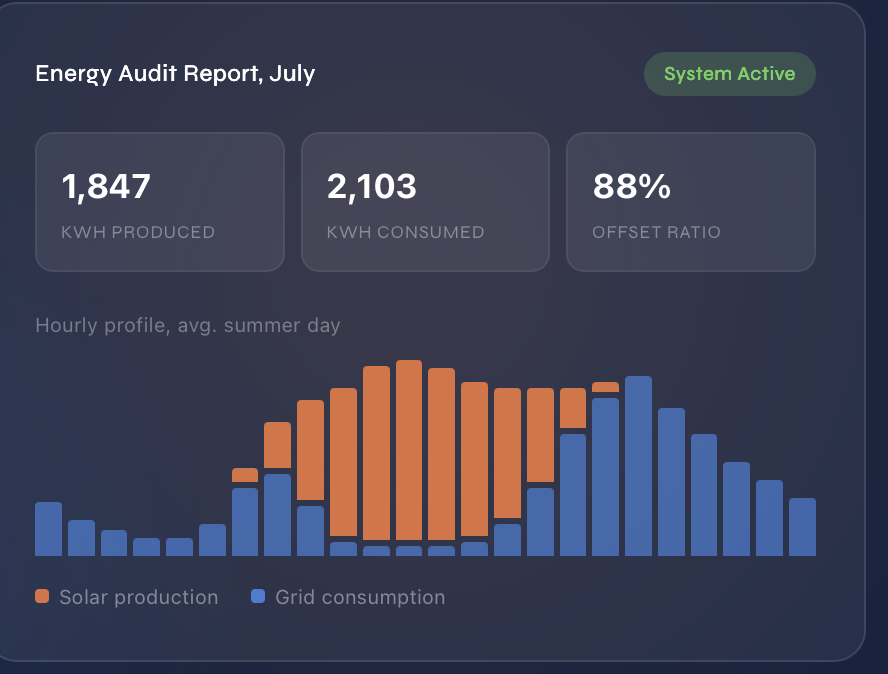
Production tells you what the system made. Consumption tells you when the property needed power. Put them together and the shape of the day becomes visible.
How much energy the system generated across the day.
+How much energy the property drew, and when.
+One clearer conversation about the system, the property, and what comes next.
The SolarFax® platform organizes the energy story without asking you to become a data analyst.
Solar production and utility consumption sit side by side in a shared view.
Compare timing, volume, and the relationship between what was made and what was used.
Use a clearer picture to explain performance, ask better questions, and decide what deserves attention.
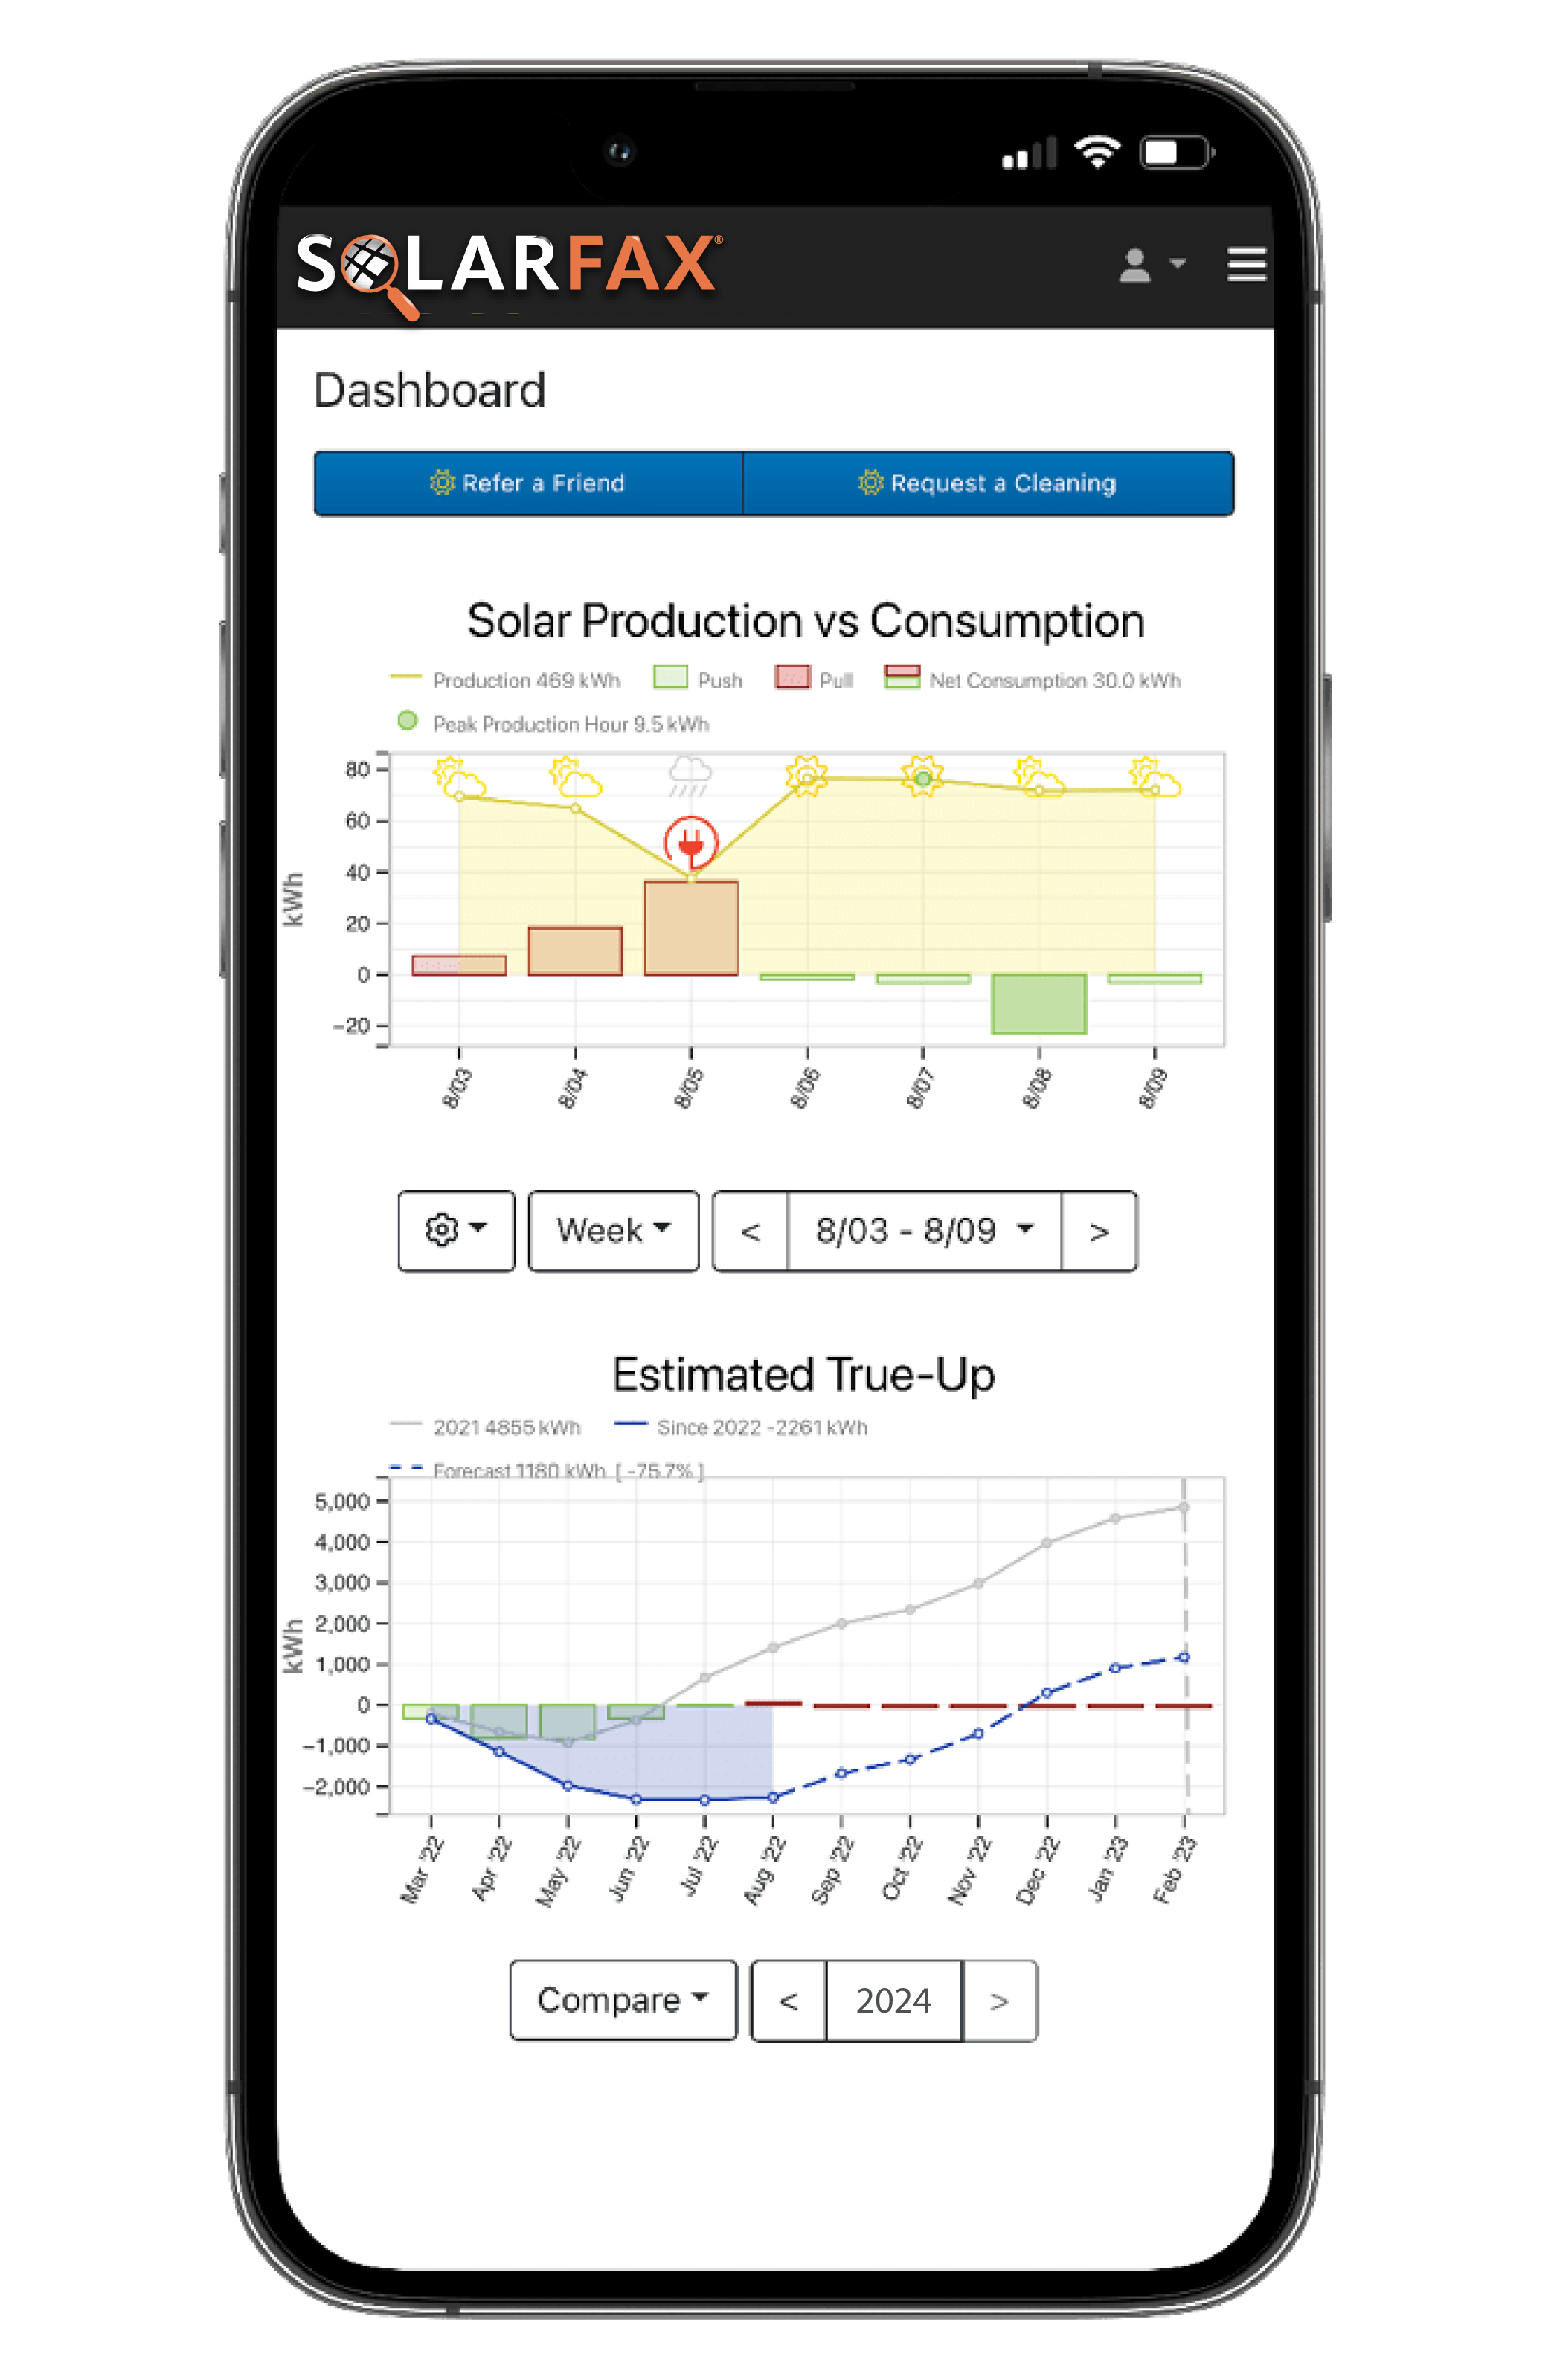
The value is not another dashboard. It is knowing which part of the energy story deserves a closer look.
Place production beside consumption to see the gap between a system's output and the home's rhythm.
S+USee the hours that shape the property's energy profile.
Give a headline ratio the context it needs to be useful.
S+UTurn a chart into a focused discussion with the customer or team.
Move from a monthly total toward the pattern underneath it.
DATAThe SolarFax® platform meets people at different points in the same energy story.
Bring production and consumption into sharper customer conversations, from first look to long-term understanding.
Explore for professionals ↗ PATH 02Understand how your solar system and your property's energy use relate across the day.
Explore for owners ↗ PATH 03Give the solar system in a property story a clearer place in the conversation.
Explore for real estate ↗The SolarFax® platform is a Solar Data Pros product, shaped around a simple belief: when the data is easier to understand, the next decision can be more grounded.
Talk with the Solar Data Pros team about the questions you need the SolarFax® platform to help answer.
Talk With an Expert ↗Select your utility provider and continue to the existing SolarFax® report request form. Your SolarFax® report is $25 per property, one-time, with no subscription required.
The existing SolarFax® report request form opens in a new tab for the next step.